


Net worth is the number most high earners track as a proxy for financial progress. Hitting $1 million, then $2 million, then some imagined finish line feels like the right metric. It isn’t.
Net worth is an asset-minus-liability snapshot. It doesn’t tell you whether you can retire, when, or what that retirement actually looks like. There’s a different number that does, and most people have never calculated it.
The financial independence ratio is the percentage of your annual spending that your portfolio can permanently replace without depleting the principal. It’s the only number that actually answers the question “can I retire yet?” — because it connects what you have to what you spend.
What Is the Financial Independence Ratio?
The calculation: Take your current invested assets (not including primary home equity, which generates no income). Multiply by your sustainable withdrawal rate — a conservative estimate is 3.5% to 4%, depending on your time horizon. Compare that annual income figure to your actual annual spending. The ratio of portfolio income to spending tells you where you are.
Why it’s more useful than net worth: Two people with very different net worth can be in completely different places on the path to independence, depending on their spending.
| Invested Assets | Annual Spending | Portfolio Income at 3.5% | FI Ratio | Where They Stand |
|---|---|---|---|---|
| $1,200,000 | $60,000 | $42,000 | 70% | Nearly independent |
| $2,000,000 | $200,000 | $70,000 | 35% | Less than halfway |
| $2,500,000 | $90,000 | $87,500 | 97% | Effectively independent |
| $3,000,000 | $250,000 | $105,000 | 42% | Still building |
Illustrative only. Withdrawal rate should be tailored to your specific timeline and situation.
The person with $1.2 million and $60,000 in annual spending is nearly twice as far along the path as the person with $2 million and $200,000 in spending. Net worth alone would never show you that.
The Social Security modifier: Per the Social Security Administration, the average monthly benefit for a retired worker in 2026 is approximately $2,071. For a married couple where both spouses receive benefits, the average household Social Security income can reach $4,000 to $5,000 per month. That guaranteed income source changes the financial independence ratio significantly, reducing the percentage of spending the portfolio needs to cover.
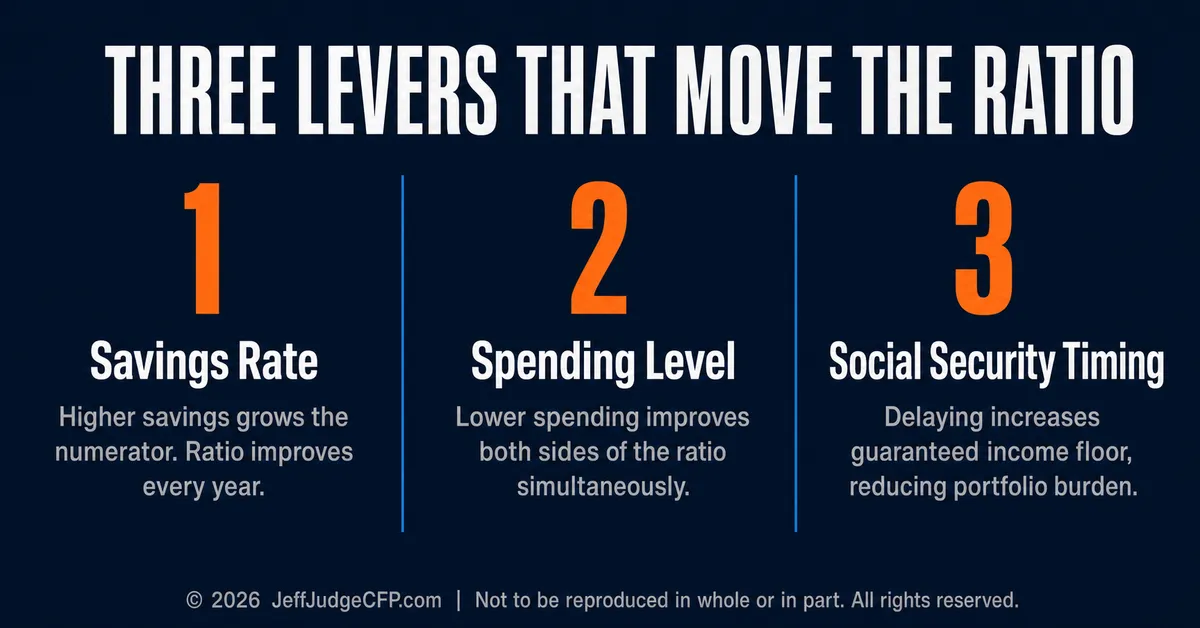
The Three Levers That Move the Ratio
Once you know your ratio, the levers become visible.
| Lever | How to Move It | Effect on Numerator | Effect on Denominator | Combined Impact |
|---|---|---|---|---|
| Savings rate | Increase contributions | Grows the portfolio | None (if lifestyle stays flat) | Ratio improves steadily each year |
| Annual spending | Reduce target spending | None | Lowers the independence threshold | Improves both sides simultaneously |
| Social Security timing | Delay claiming to 70 | Adds guaranteed income floor | Reduces portfolio burden required | Net required portfolio shrinks meaningfully |
The savings rate lever: Every dollar added to the portfolio increases the numerator while keeping the denominator fixed, if lifestyle stays constant. Increasing the savings rate meaningfully can move the ratio by 3 to 7 percentage points annually, depending on the starting portfolio size.
The spending lever: Reducing annual spending improves the ratio on both sides simultaneously. It increases the coverage percentage and reduces the total spending target that defines independence. Spending $150,000 per year versus $200,000 per year doesn’t just save $50,000 annually. It changes the portfolio target required for independence by $1.25 to $1.5 million (at standard withdrawal rates).
The Social Security timing lever: Per the Social Security Administration, delaying from full retirement age to age 70 increases the monthly benefit by 24%. For a high earner, that increase on a meaningful benefit could reduce the required portfolio size by $200,000 to $400,000. A higher guaranteed income floor means the portfolio carries less of the load.
Why Most People Have Never Run This Number
The financial services industry is built around accumulation. The messaging is about growing your portfolio, not about defining and measuring progress toward a specific independence threshold. Net worth is easier to market than a ratio nobody knows how to calculate.
There’s also a psychological resistance to knowing. Calculating the ratio reveals exactly where you are and exactly how far you have to go. That can be motivating or deflating depending on the gap. Most people prefer the ambiguity of “doing well” to the precision of “35% of the way there.”
But precision is what allows you to act. If you know you’re at 35% and need to be at 100% in 15 years, you know what trajectory is required and which lever moves the number fastest. If you don’t know where you are, you can’t optimize the path.
Schedule a no-obligation call with Jeff to calculate your financial independence ratio and map what changes it most for your specific situation.
The information provided is for educational purposes only and should not be construed as investment advice. Investment strategies should be tailored to individual circumstances, risk tolerance, and goals. Past performance doesn’t guarantee future results. Consult with qualified financial professionals regarding your specific situation. Securities offered through LPL Financial, Member FINRA/SIPC. Investment advice offered through Great Valley Advisor Group, a registered investment advisor and separate entity from LPL Financial. © 2026 JeffJudgeCFP.com | Not to be reproduced in whole or in part. All rights reserved.