


Your average annual return over 30 years of retirement does not determine whether your money lasts. The order those returns arrive in does. Specifically, what happens in the first five to seven years of withdrawals may matter more than every investment decision you made in the three decades before you retired. This is sequence of returns risk, and it’s the variable most retirement conversations spend the least time on.
What Is Sequence of Returns Risk?
Sequence of returns risk is the danger that poor investment returns early in retirement, combined with ongoing withdrawals, will permanently deplete a portfolio in a way that strong long-run average returns cannot fix. A portfolio hit by large losses in years one through five of withdrawals may not recover even if the market subsequently performs well, because withdrawals taken during the downturn lock in those losses and reduce the base that benefits from any recovery.
Two people can retire with identical portfolios, withdraw the same amount each year, experience the same annual returns in reverse order, and end up with dramatically different balances at the end of 30 years. Same average return. Different sequence. Completely different outcome. The math isn’t complicated, but almost no one runs it before they retire.
According to the Social Security Administration, the average retirement age in the U.S. is approximately 65. A 30-year retirement is a real and common planning horizon, not an outlier. The first decade of that window is where sequence risk does the most damage.
The Four Factors That Determine Whether Sequence Risk Hurts You
Not every retiree is equally exposed. These four factors determine how much sequence risk threatens your specific plan.
| Factor | What it measures | How it changes your exposure |
|---|---|---|
| Withdrawal rate | Annual distributions as % of portfolio | Higher rates leave less room to absorb early losses; rates above 4-5% increase vulnerability significantly |
| Spending flexibility | Ability to reduce distributions in down years | A 10-15% temporary reduction in a bad year materially extends portfolio longevity |
| Equity allocation at retirement | % of portfolio in stocks at the start of withdrawals | Heavy equity exposure in year one amplifies the damage from an early decline |
| Buffer assets | Cash or short-duration bonds set aside for near-term income | 12-24 months of expenses in a buffer means no forced equity selling during a downturn |
Withdrawal rate. The higher your annual withdrawal as a percentage of your portfolio, the more vulnerable you are to a bad early sequence. A 2% annual withdrawal gives the portfolio room to absorb early losses. A 6% withdrawal taken during a 30% market decline in year two creates a hole that compounds with every subsequent distribution.
Spending flexibility. A retiree who can reduce discretionary spending by 10 to 15 percent during a bad market run has a meaningful structural advantage over one whose spending is fixed. Social Security income and any pension provide a base that reduces the need to sell assets during downturns. Per the Social Security Administration, delaying Social Security benefits from 62 to age 70 can increase your monthly benefit by more than 75 percent for those with a full retirement age of 67. That higher base income directly reduces how much the portfolio needs to distribute during the highest-sequence-risk years.
Asset allocation in the years immediately before and after retirement. The period from roughly five years before retirement to five years after is where sequence risk is most concentrated. A 100% equity allocation makes sense for a 35-year-old. It makes less sense for someone entering the withdrawal phase with no buffer against a severe early decline.
Buffer strategy. A cash or short-duration bond position covering 12 to 24 months of living expenses means you don’t have to sell equities during a downturn to fund your spending. That buffer doesn’t need to be large. But its existence fundamentally changes how a portfolio behaves in the early years of retirement.
The Numbers That Show Why Average Returns Are Misleading
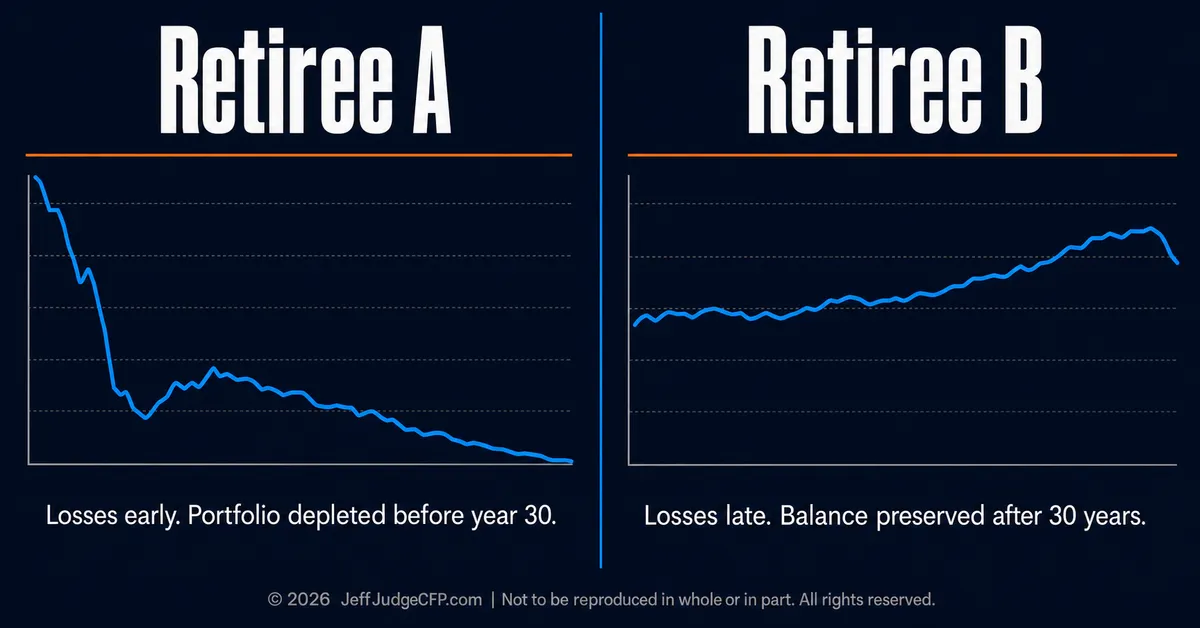
Here’s a simplified illustration of what the sequence difference actually produces. Two retirees each start with $1,000,000 and withdraw $50,000 per year.
| Retiree A | Retiree B | |
|---|---|---|
| Years 1-2 returns | -20%, -15% | +12%, +10% |
| Remaining years | +10% average annually | +10% average annually, then -20%, -15% in final years |
| 30-year average return | Approximately 7% | Approximately 7% |
| Estimated balance at year 30 | Portfolio likely depleted well before year 30 | Balance likely near or above starting value |
Illustrative only. Actual results depend on return sequence, withdrawal timing, and specific annual figures.
The critical difference isn’t the average. It’s whether the bad years arrive during withdrawals or after them. Per IRS Publication 590-B, required minimum distributions begin at age 73, using a life expectancy factor of 26.5 at that age. For a retiree starting voluntary withdrawals at 65, the window before RMDs begin is precisely when sequence risk is most acute, and when the structure of the portfolio matters most.
Why Most Retirement Projections Don’t Model This Honestly
Sequence of returns risk is hard to visualize and easy to dismiss. When a retirement projection shows an average annual return of 7% over 30 years, the bad scenarios are averaged into the number. The projection looks solid. What it doesn’t show is the distribution of outcomes depending on when the bad years arrive.
The planning industry has historically been better at presenting a single optimistic scenario than at surfacing the range of outcomes under different return sequences. A projection built around average returns tells a smoother story than one that shows what happens if the first five years of retirement include a significant market decline.
Stress-testing a retirement plan against bad early sequences isn’t pessimism. It’s the difference between a plan that only works if returns arrive in the right order and one built to survive the realistic range.
What to Do Before Retirement to Reduce Sequence Risk
There is no single fix. Sequence risk is managed through a combination of decisions that collectively reduce the portfolio’s vulnerability before the withdrawal phase begins.
Build 12 to 24 months of living expenses into a cash or short-duration buffer before you retire. This is not your emergency fund. It’s a dedicated distribution reserve that lets you avoid selling equities in a down market during the first years of withdrawals.
Evaluate whether your withdrawal rate can be reduced by delaying retirement, reducing spending, or optimizing Social Security timing. The decisions that matter most, your withdrawal rate, your buffer strategy, your allocation transition, and your Social Security timing, all need to be made before retirement, not during the first bear market after it.
Transition your asset allocation in the five years before retirement. The goal isn’t to abandon equities. The goal is to reduce the percentage of your portfolio that’s fully exposed to a severe decline in year one or two of withdrawals.
Identify which spending categories are flexible. Knowing in advance that you can cut discretionary spending by $15,000 in a down year gives you options that an inflexible budget doesn’t.
The variable that determines whether your retirement holds isn’t your average return. It’s whether your portfolio structure can survive the years when returns arrive in the worst possible order.
Schedule a no-obligation call with Jeff to run your retirement income strategy through a sequence of returns analysis before you retire.
The information provided is for educational purposes only and should not be construed as investment advice. Investment strategies should be tailored to individual circumstances, risk tolerance, and goals. Past performance doesn’t guarantee future results. Consult with qualified financial professionals regarding your specific situation. Securities offered through LPL Financial, Member FINRA/SIPC. Investment advice offered through Great Valley Advisor Group, a registered investment advisor and separate entity from LPL Financial. © 2026 JeffJudgeCFP.com | Not to be reproduced in whole or in part. All rights reserved.